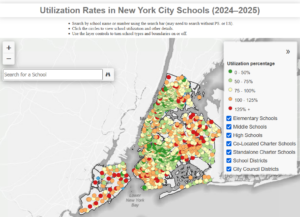
New! Map of NYC school utilization rates
The data is the latest DOE has made available from last year’s 2021-2022 Enrollment, Capacity and Utilization Report 2021 – 2022 or the “Blue Book.” For a larger view that is easier to use with a few more features, check out the CSM github map here.
By using the dropdown box on the upper right hand corner, you can sort by school district, Council district, or type of school.
Social Networks: