New: Interactive NYC School Utilization Map for 2025-2026
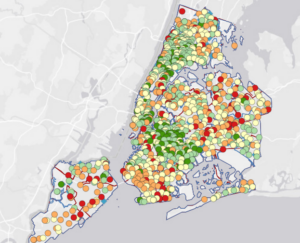
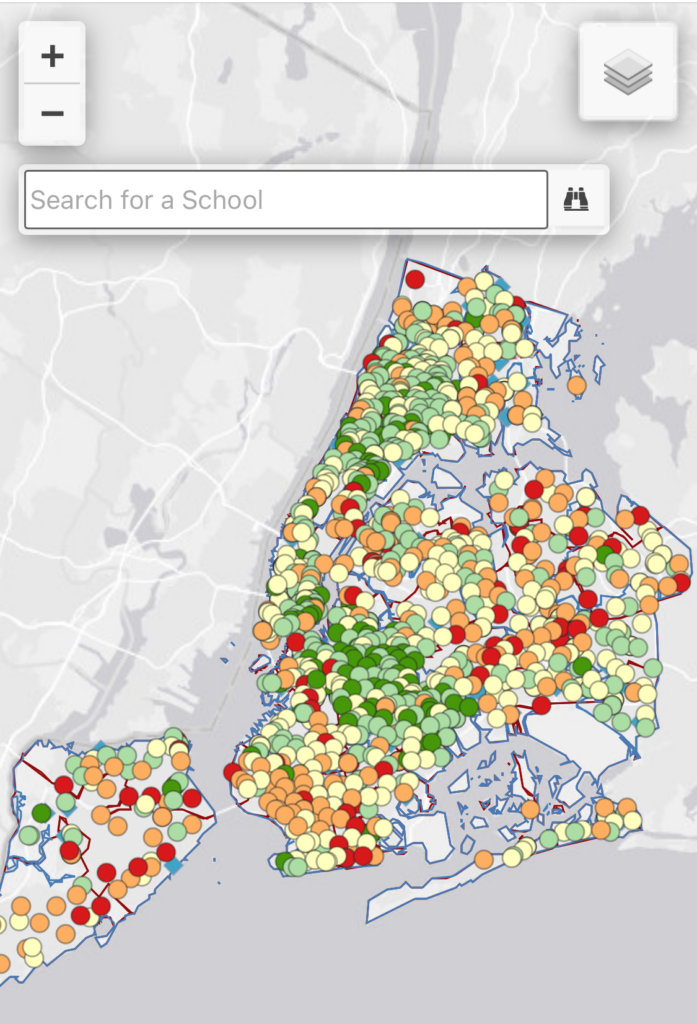
Below is a screenshot of our latest interactive webmap, which shows utilization rates at schools across New York City, revealing how many overcrowded schools are close to underutilized schools of the same grade levels. The data is from the latest 2025-2026 Enrollment, Capacity and Utilization Report, known as the “Blue Book.”
By using the dropdown box on the upper right hand corner, you can sort by school district, Council district, and type of school. You can also zoom in or zoom out, and search for individual schools in the search bar for their utilization, enrollment, and capacity data for each school.
Click on the map below to get to the webpage, or check out our map here.
Social Networks: